
আরও দেখুন


 12.11.2026 01:32 PM
EUR/USD continued to decline on Wednesday and ended the day near the 1.1081–1.1086 support level, below the horizontal trading range. Until the pair closes below the 1.1081–1.1086 level, it would be premature to conclude that the sideways movement has ended and the bearish trend, which began three months ago, has resumed. In my view, bears have gained no additional reasons to sell over the past few days. All the reports that were favorable to the dollar have already been priced in.
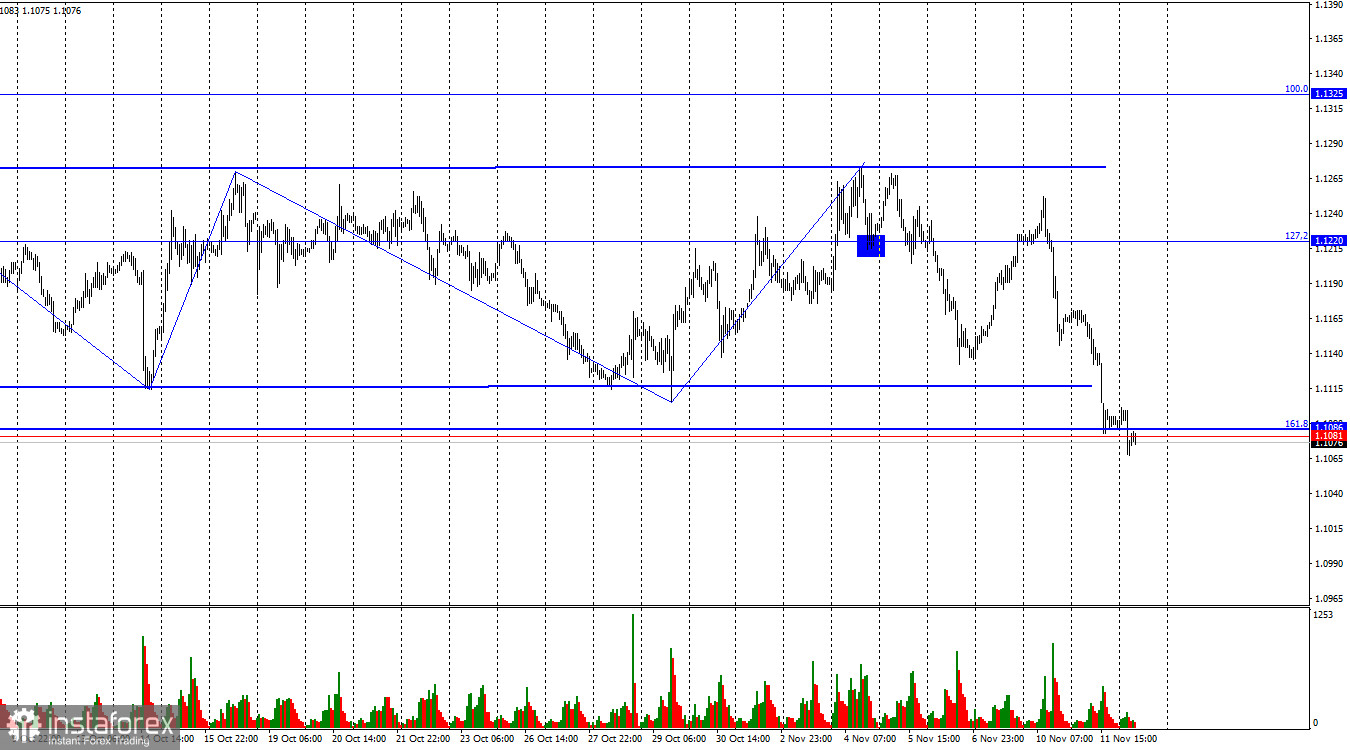
The wave structure on the hourly chart remains bearish. The latest completed upward wave failed to break above the previous peak, while the latest downward wave broke below the previous low. Following the September FOMC meeting, traders have been expecting at least one more round of monetary policy tightening by the end of the year and another one next year. This factor continues to support the US currency, while economic data from the United States only increase the likelihood of a hawkish scenario.
There was virtually no significant news flow on Wednesday, but this did not discourage the bears, who continued selling as if the inflation report had been released twice, on both Tuesday and Wednesday. It is understandable that higher inflation growth rates make several rounds of FOMC monetary policy tightening more likely. However, the dollar has already been rising for three months, and bears have continued selling with only brief pauses throughout this period. Moreover, Fed officials expect inflation to slow next year.
In other words, the potential for further interest rate increases in the United States is limited in any case and does not justify the dollar's three-month rally. Christine Lagarde and the ECB are also prepared to raise interest rates further, but this has failed to provide any meaningful support for the euro. Why? In my view, the euro will undoubtedly have to regard 2026 as a negative year, but the fundamental background has not been unfavorable enough to justify its continued decline. Nevertheless, traders still have technical levels to guide their trading decisions, and market movements cannot be easily challenged.
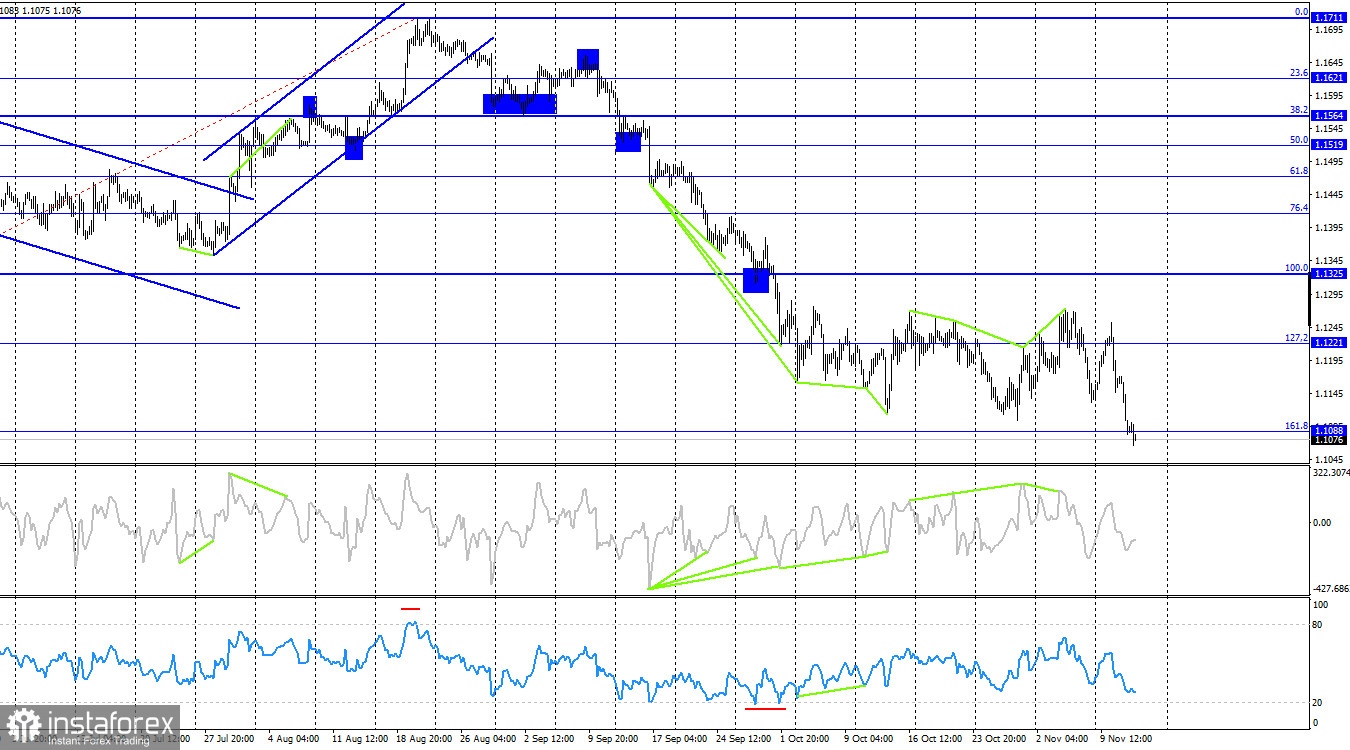
On the 4-hour chart, EUR/USD has reversed in favor of the US currency once again and declined to the 161.8% Fibonacci level at 1.1088. A rebound from this level would favor the euro and could lead to some upward movement toward the 127.2% retracement level at 1.1221. Consolidation below 1.1088 would increase the likelihood of further declines. No new emerging divergences are currently visible on any of the indicators.
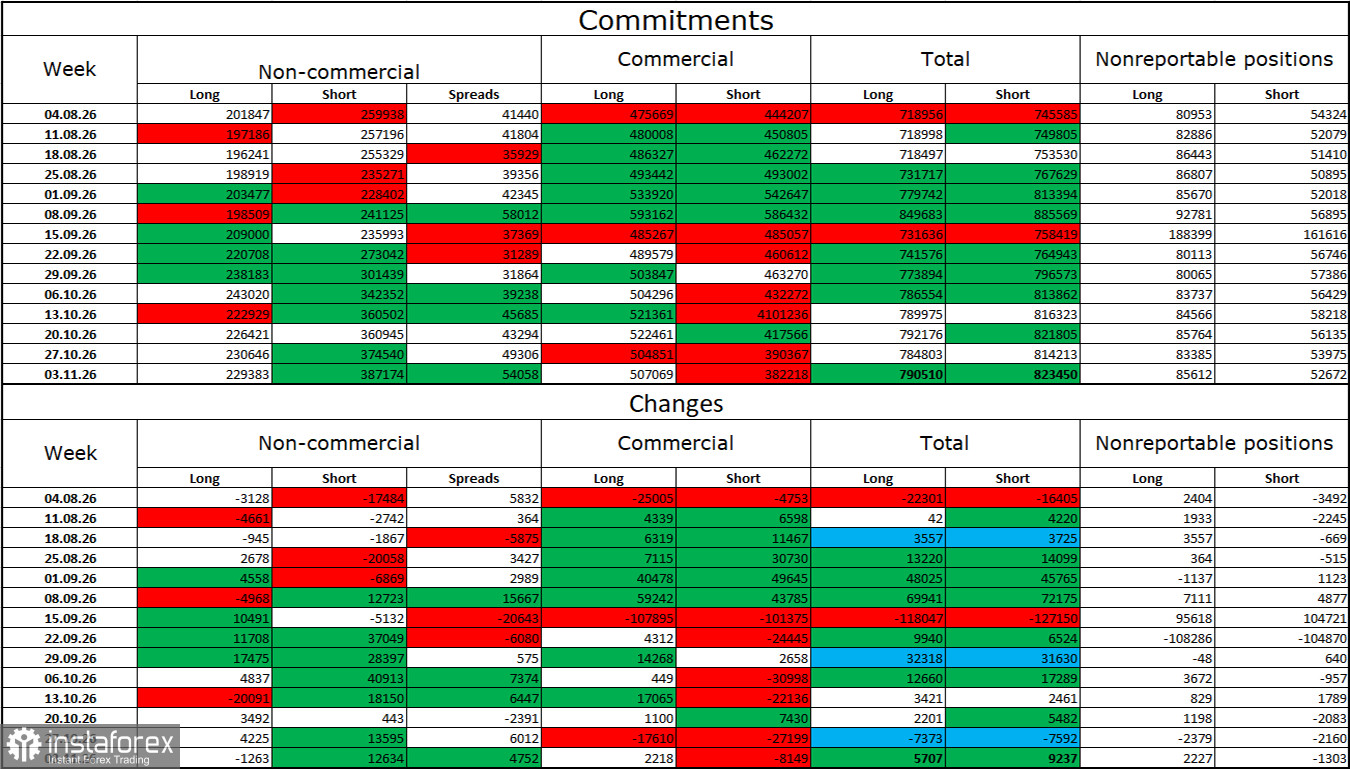
During the latest reporting week, professional traders closed 1,263 Long positions and opened 12,634 Short positions. The total number of Long positions held by speculators currently stands at 229,000, while the number of Short positions amounts to 387,000. Bears remain firmly in control, and the euro continues to be sold more frequently than it is bought. This can be attributed to the challenging geopolitical situation in the Middle East and the Fed's willingness to continue tightening monetary policy. The market believes that the Fed will keep raising interest rates for as long as necessary.
Overall, large market participants continue to show considerable interest in the euro over the longer term. Global developments of various kinds, which have been particularly numerous in recent years, undoubtedly influence investor sentiment and put pressure on risk-sensitive currencies. Furthermore, 2026 could set a record for the number of unexpected events that could not have been anticipated in advance. For this reason, the euro is waiting for more favorable conditions.
On November 12, the economic calendar contains three events, with Christine Lagarde's speech being the only one worth particular attention. The impact of economic news on market sentiment is expected to be limited on Thursday.
Buying opportunities may arise following a rebound from the 1.1081–1.1086 level on the hourly chart, with targets at 1.1220 and 1.1270. Selling opportunities may arise today if the pair consolidates below the 1.1081–1.1086 level on the hourly chart, with a target of 1.0939–1.0944.
The Fibonacci retracement levels are drawn from 1.1325 to 1.1712 on both the hourly and 4-hour charts.


