
আরও দেখুন


 17.11.2026 08:59 AM
Bitcoin is hovering around $64,500 after falling to $62,000 over the weekend, and I consider this bounce a false move. In my view, the bear market isn't over yet, and the nearest decline target lies in the $50,000–$59,000 range. All the signs I rely on point in one direction.

The main technical argument is the break below the 200-week moving average at about $68,000. In past bear markets, price often found its cycle bottom near that line, so I view a move below it as confirmation of weakness rather than a random poke. Notably, in early summer the low near $58,500 seemed to many like a reversal point, and now the price has again approached those levels with nothing to support it.
Money is leaving, not coming. About $1.9bn has flowed out of bitcoin ETFs net since the start of 2026, while $21bn entered them in all of 2025. Stablecoin supply has declined by $14–16bn over the last 30 days and fell to roughly $280bn — a level not seen since September 2025. This directly signals that fresh capital is not entering the market, and any rally now lacks fuel.
I do not regard massive liquidations as a sign of a bottom. Over the weekend, more than $2bn left the market in a single day, but the bounce from $62,000 was driven by short-covering rather than the arrival of new buyers. On November 3, when bitcoin traded around $80,500, confident claims were made that the bottom was in, and since then the price has lost about 20%. Bonds add pressure: the 10-year Treasury yield rose above 5.1%, the market is almost fully pricing a December Federal Reserve hike, and in such an environment bitcoin — which pays no interest — loses out to bonds.
Ether around $1,800 has already lost about 38% year-to-date, but without new inflows I see no reason for it to outperform on a rebound. The coming days add risk: Nvidia's report on November 17 and Anthropic's IPO on November 18–19 could intensify the sell-off in risk assets. Those who draw analogies with SpaceX overlook that back then bitcoin fell another 18 days after trading began and found a bottom only in late June.
My base scenario is this: first, bitcoin will retest $62,000 and $60,000, after which a decline to the $50,000–$59,000 range is likely, where I see no meaningful support because price passed that zone quickly during the 2024 rally. I will become less cautious only when the price returns above $68,000 and new capital begins flowing into funds.
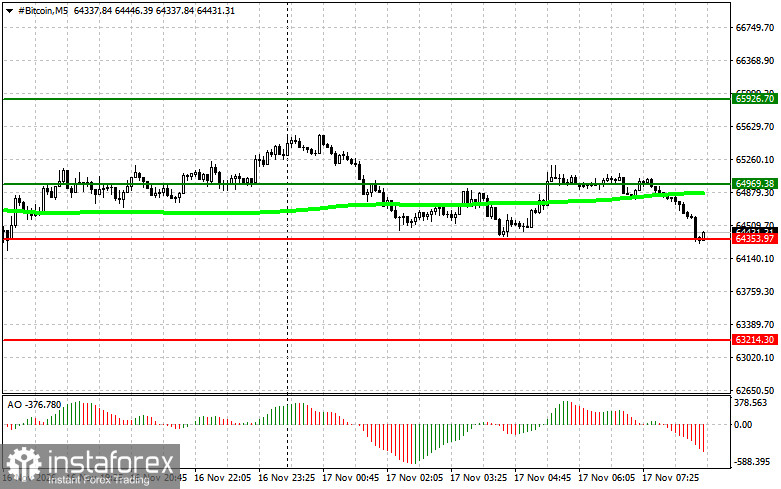
The nearest range for Bitcoin is between $64,300 and $64,900, and the plan centers on two mirror directions with a full set of breakout and bounce scenarios. If price decisively consolidates above $64,900, provided it is above the 50-day moving average and the Awesome Oscillator is above zero, I consider buy positions targeting $65,900, where profits should be taken, and watch for a short on the pullback. If a break below $64,300 proves to be a false spike and price returns to the range, long positions also work—first targeting the upper boundary at $64,900 and then $65,900.
The selling side is symmetric. A confirmed break below $64,300, provided the 50-day MA is above price and the Awesome Oscillator is below zero, opens the way for a short targeting $63,200. If a break above $64,900 fails to confirm and price reverses, short positions are also acceptable—initially targeting a return to $64,300 and then $63,200.
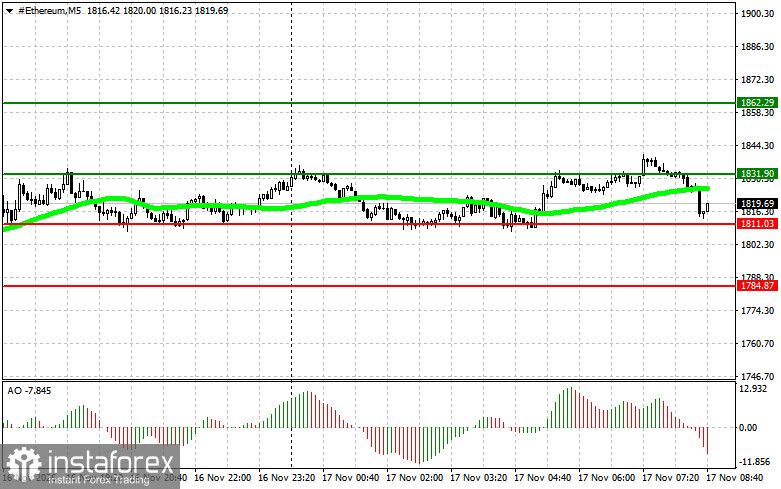
The logic mirrors bitcoin's on its own price scale. The nearest range is between $1,801 and $1,831. A confirmed consolidation above $1,831, provided price is above the 50-day MA and the Awesome Oscillator is above zero, gives buys with a target of $1,862; a bounce off $1,801 without a confirmed break lower gives buys first to $1,831, then to $1,862. A confirmed break below $1,801, provided the MA is above price and the Awesome Oscillator is below zero, opens a short to $1,784, and a rejection at $1,831 without a confirmed breakout higher also leads to shorts, first to $1,801 and then to $1,784. Both indicators serve as filters to weed out false moves rather than standalone entry signals, and decisions are made only after the price actually confirms the specified levels.


