
আরও দেখুন


 19.11.2026 06:05 AM
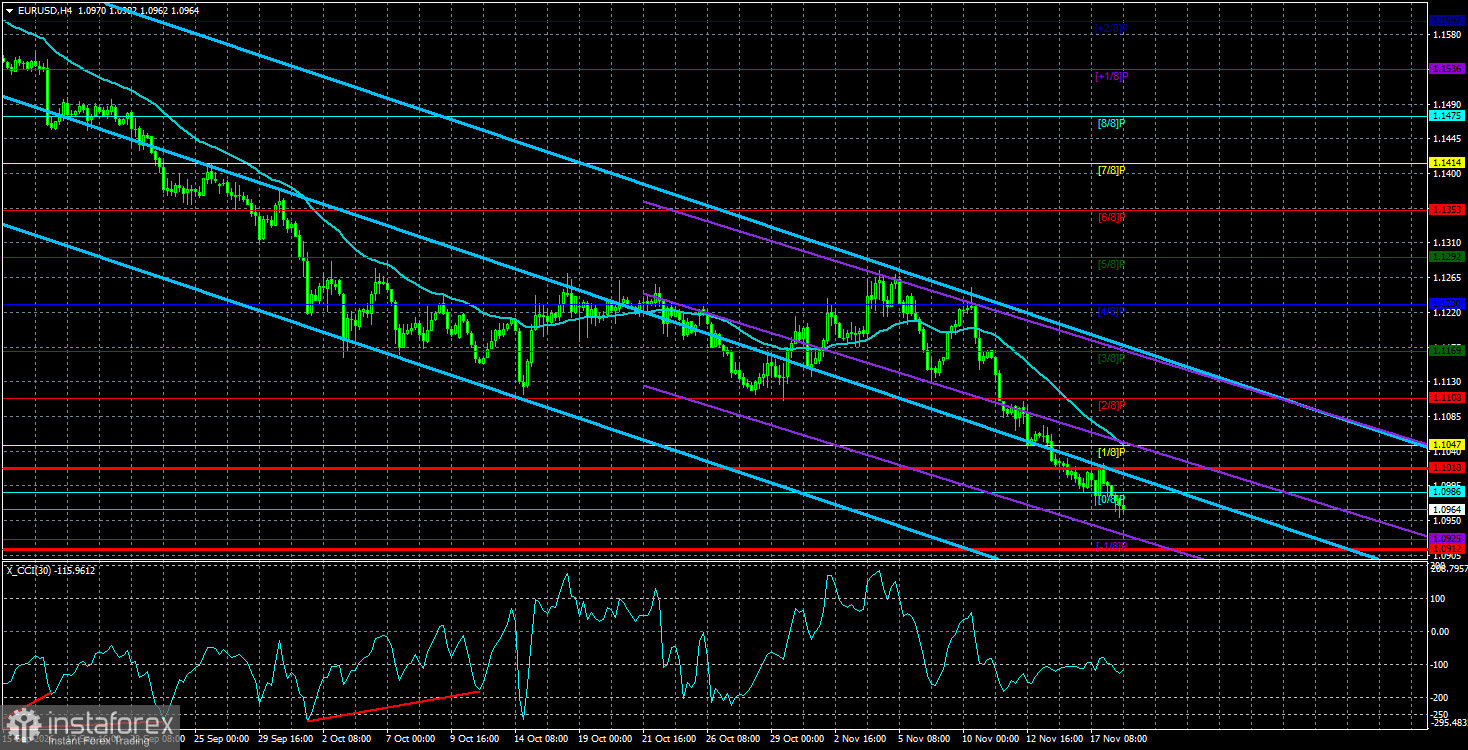
The EUR/USD currency pair continued its downward move on Wednesday, which probably surprises no one. The European currency fell for almost the entire past week and is falling this week as well. Reasons and pretexts, as always, are easy to find if one is willing. Moreover, you can't say the dollar is rising rapidly. No — it rises unhurriedly, by several dozen pips a day. But every day!
Frankly, the situation in the FX market around the US dollar already looks simply absurd. We ignore the fact that the dollar has been rising for more than three months straight while the euro cannot even correct, as if we were talking about the Iranian rial. We ignore the fact that the European Central Bank is hiking rates faster and, at present, more aggressively than the Federal Reserve. We ignore that inflation in the eurozone is accelerating, just as it is in the US. We ignore the fact that the ECB may ultimately tighten as many times as the Fed. Yet even local macroeconomic reports are interpreted by the market only in favor of the dollar.
The apex of absurdity was Tuesday. Again, let us ignore the secondary ZEW indices in the eurozone and Germany. Let us focus only on the relatively important US retail sales and industrial production. Retail sales rose 0.2%, matching forecasts and far below the gain a month earlier. Industrial production fell 0.4%, though traders expected 0.1–0.3% growth. Thus at least one of the two reports was negative for the dollar and the other neutral. And yet the US currency continued to appreciate on Tuesday and then on Wednesday.
How did experts explain the market's incongruous reaction to US data? Simply and banally: the retail sales report is more important than the industrial production report. How did they explain the dollar's further rise? Simply and banally: rising "hawkish" expectations about Fed policy. That's all you need to know about the logic behind the dollar's current rally.
We continue to believe the current move is pure speculation and inertia. Market participants see that the dollar rises every day. What do you do with a currency that rises every day? Naturally, buy it. So nobody cares whether the dollar's rise is justified by fundamentals or macroeconomics. The dollar rises because people buy it. And it is bought because it rises. This explanation may seem childish to some, but over the past three months, this "childish explanation" has best fit reality.
Thus, the US currency can keep rising as long as the market wants, because its grass now looks far greener than the neighbor's. Experts will continue to talk daily about "growing hawkish sentiment." Soon the euro may fall to the 1.0750–1.0800 area where the weekly-timeframe ascending trendline runs... Near that line, it will become clear what to expect in the long term.
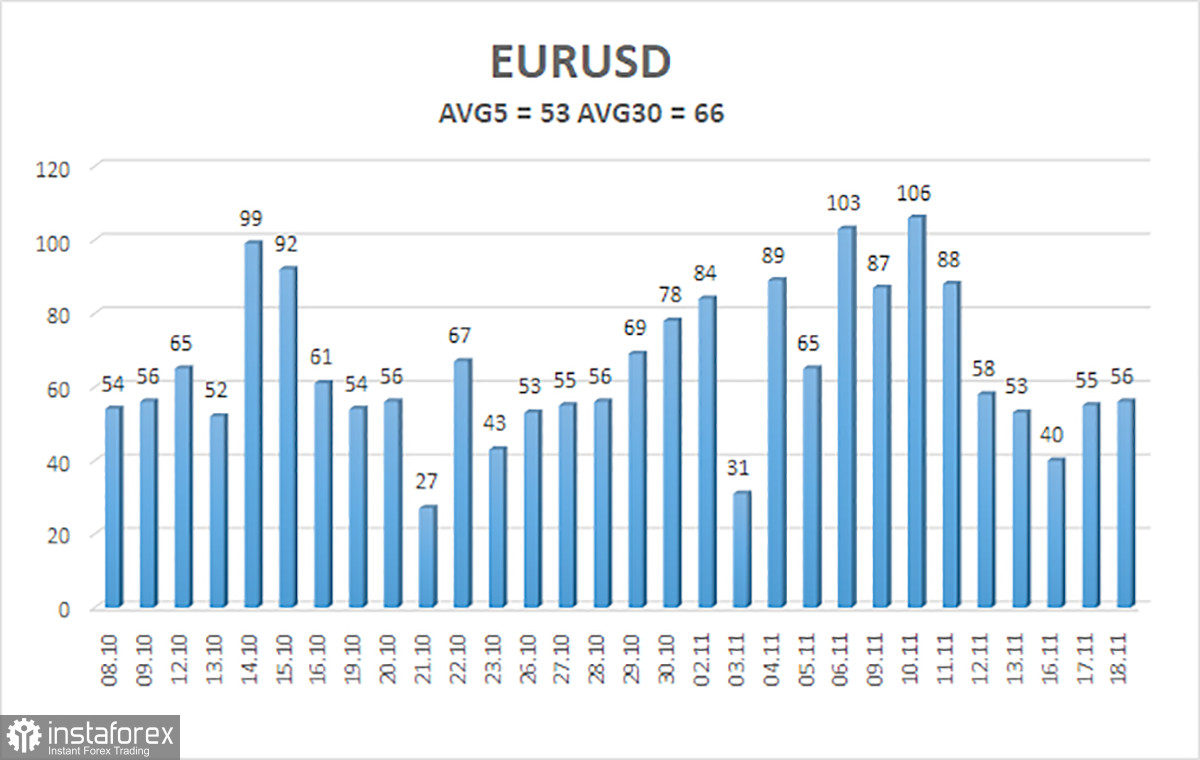
The average volatility of the EUR/USD currency pair over the last 5 trading days as of November 19 is 53 pips and is characterized as "average." We expect the pair to move between the levels 1.0912 and 1.1018 on Thursday. The higher linear regression channel is directed downward, indicating a downtrend. The CCI indicator entered the oversold area five times and formed four "bullish" divergences, and all these signals were ignored. The illogical downward trend persists.
S1 – 1.0925
S2 – 1.0864
R1 – 1.0986
R2 – 1.1047
R3 – 1.1108
The EUR/USD pair remains in a downward channel with insufficient fundamental, macroeconomic, and geopolitical justification. The global fundamental backdrop for the dollar remains negative, but in 2026, geopolitics and then the Fed's hawkish stance provided strong support for the US currency. Practically all other factors have been ignored for the past three months. With the price below the moving average, shorts can be considered, targeting 1.0925 and 1.0912, since the trend remains downward. Above the moving average, long positions can be considered with targets of 1.1108 and 1.1169, because the illogical fall will end sooner or later.


