
See also


 18.11.2026 01:25 PM
Gold fell 2% in a day to $3,763 an ounce, while Bitcoin held near $64,000, and the ratio between them rose more than 1.6% and climbed above the 200-day moving average. Now one Bitcoin buys about 17 ounces of gold, which is 40% more than in March, when the metric fell to roughly 12.

The same factor is weighing on both assets: expectations of Fed rate hikes. The probability of a 25-bp move on December 9 is roughly 97%. The market also prices further hikes in January and April. High rates support the dollar and make non-yielding assets less attractive, so gold has suffered more. Later today the Fed will publish the minutes of its October meeting, at which the policy rate was left at 3.75–4.00% after the September hike—the first since 2023—and two committee members voted for an additional 25-bp step.
But relative strength does not imply absolute gains. Since late September, when Bitcoin traded around $85,000, it has lost about 25%. In early November, with Bitcoin at about $80,500 and gold near $3,940, the ratio was roughly 20 ounces—about 16% lower than today. It remains far from the December 2024 peak of about 41 ounces. Thus, the current rise in the metric reflects gold falling faster rather than buyers returning to Bitcoin.
All this suggests that until the Fed meeting on December 9, gold will remain more vulnerable to rising rates and a stronger dollar than Bitcoin is, and the ratio still has scope to move toward 18.5 ounces, where it stood in January. At current gold prices, that corresponds to Bitcoin around $69,600. This scenario will play out if gold does not bounce and the Fed minutes are not tougher than expected. Otherwise, in my view, both assets will face pressure, and Bitcoin could return to the weekend low near $62,000 before the ratio reaches January levels.
Technical analysis and recommendations:
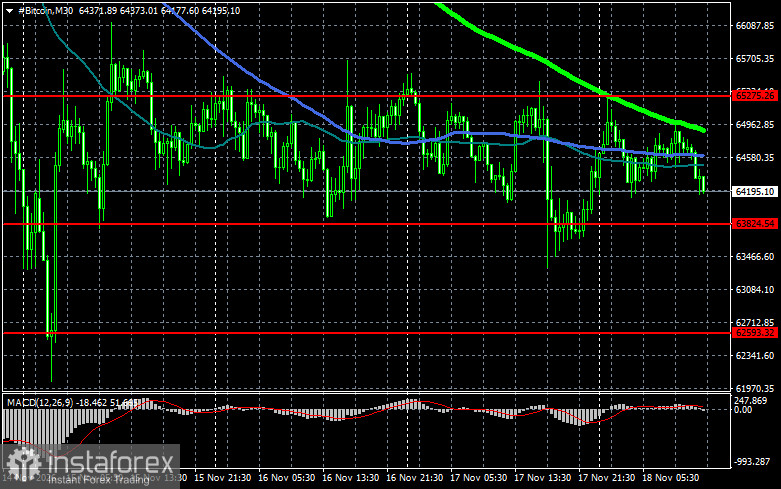
As for BTC, buyers are currently targeting a return to $65,300, which would open a direct path to $66,500 and then to $68,200; clearing that level would signal attempts to restore a bull market. On the downside, I expect buyers around $63,800. A close below that area could quickly push BTC toward $62,800, with a farther target near $60,600.
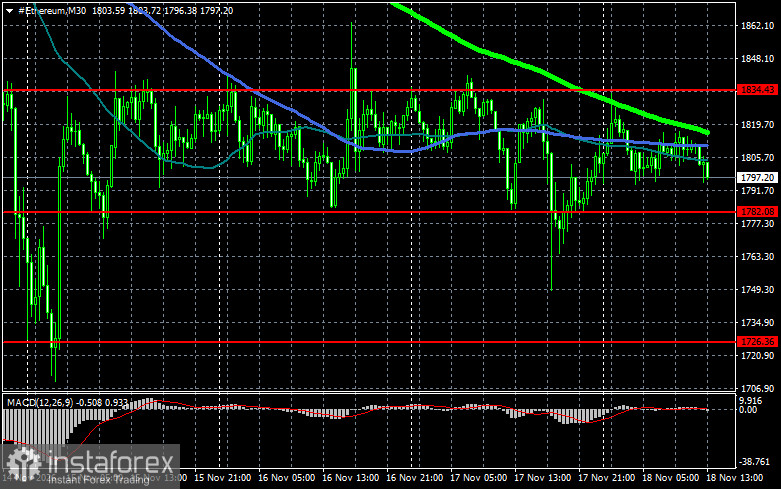
As for Ethereum, a clear close above $1,834 opens a direct path to $1,872. The farther target is the high near $1,916; breaching that would indicate strengthening bullish sentiment and renewed buyer interest. On the downside, buyers should appear at $1,782. A move below that area could quickly take ETH toward $1,726, with a farther target near $1,650.
What we see on the chart:
- Red lines indicate support and resistance levels where either a price slowdown or active growth is expected;
- Green lines indicate the 50-day moving average;
- Blue lines indicate the 100-day moving average;
- Light green lines indicate the 200-day moving average.
A crossover, or a price test of moving averages, typically either halts the move or sparks fresh market momentum.


