
See also


 19.11.2026 01:06 PM
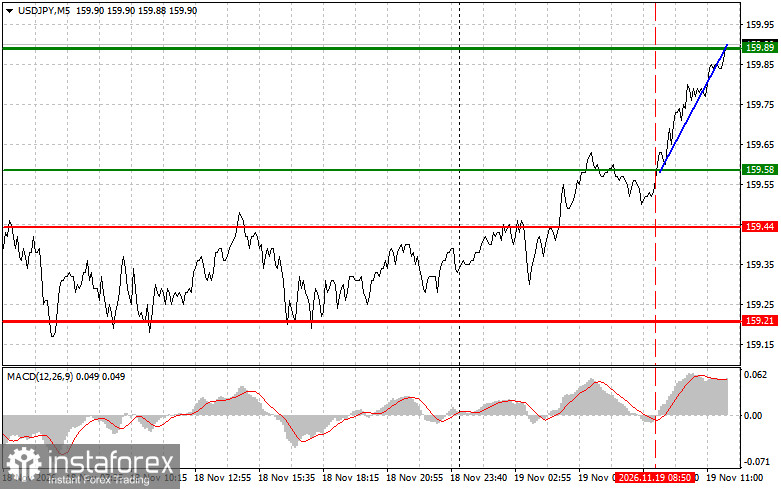
The test of the 159.58 level occurred just as the MACD indicator was beginning to move upward from the zero line, confirming that it was the right entry point for buying the US dollar. As a result, the pair moved higher to around the target level of 159.89.
Japanese economic data released today were mixed and should be compared with the US figures due in the second half of the day. Machinery orders for September increased by 13.4% year over year, against a forecast of 13.7%, following an 18.6% rise. On a monthly basis, however, they declined by 0.3%, compared with an expected increase of 1.3%, following a previous rise of 5.2%. This indicator tends to lead business investment by several months, and companies noticeably slowed their activity compared with August.
Japanese investors' purchases of foreign bonds totaled minus 440.7 billion yen, compared with minus 534.1 billion previously. Meanwhile, foreign investors sold 224.1 billion yen worth of Japanese shares, versus 102.3 billion yen a month earlier.
In the US, initial jobless claims are expected to come in at 198,000, following 200,000, while the Philadelphia Fed Manufacturing Index is forecast at 20.6, compared with 20.9 previously. The index has declined from 37.8 in September.
If US figures confirm that the labor market remains strong and Hammack, Goolsbee, and Barr maintain their hawkish tone, support for the dollar will strengthen, especially since futures markets are already pricing in a 0.25% rate hike on December 9. According to more than 80% of economists, the Bank of Japan will raise its policy rate from 1.25% at its December 17–18 meeting, although the slowdown in orders adds a note of caution. I expect that, as long as the Federal Reserve appears more determined, USD/JPY will retain its upward potential, while any decline will be corrective.
As for the intraday strategy, I will place greater emphasis on the implementation of Scenarios No. 1 and No. 2.
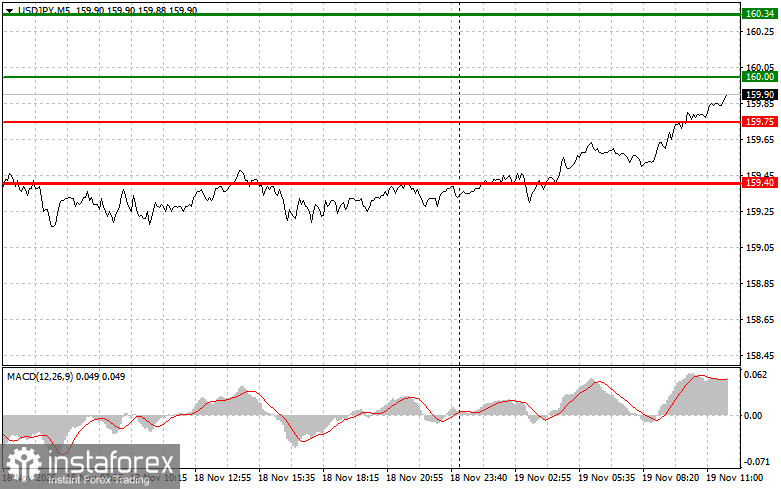
Scenario No. 1: Today, I plan to buy USD/JPY when the price reaches the entry point around 160.00 (the green line on the chart), targeting a rise to 160.34 (the thicker green line on the chart). Around 160.34, I will close my long positions and open short positions in the opposite direction, targeting a move of 30–35 points in the opposite direction from that level. The pair is likely to rise today only if US economic data are strong. Important! Before buying, make sure that the MACD indicator is above the zero line and is just beginning to rise from it.
Scenario No. 2: I also plan to buy USD/JPY today if the price tests the 159.75 level twice consecutively while the MACD indicator is in the oversold area. This will limit the pair's downward potential and trigger a reversal to the upside. The price could rise toward the opposite levels of 160.00 and 160.34.
Scenario No. 1: Today, I plan to sell USD/JPY after the 159.75 level is broken (the red line on the chart), which should lead to a rapid decline in the pair. The sellers' key target will be 159.40, where I will close my short positions and immediately open long positions in the opposite direction, targeting a move of 20–25 points in the opposite direction from that level. Pressure on the pair could return today if the central bank intervenes. Important! Before selling, make sure that the MACD indicator is below the zero line and is just beginning to fall from it.
Scenario No. 2: I also plan to sell USD/JPY today if the price tests the 160.00 level twice consecutively while the MACD indicator is in the overbought area. This will limit the pair's upward potential and trigger a reversal to the downside. The price could decline toward the opposite levels of 159.75 and 159.40.
Important. Beginner Forex traders should make market-entry decisions very carefully. Before the release of major fundamental reports, it is best to stay out of the market to avoid exposure to sharp exchange-rate fluctuations. If you decide to trade during news releases, always place Stop Loss orders to minimize losses. Without Stop Loss orders, you can lose your entire deposit very quickly, especially if you do not use proper money management and instead trade large position sizes.
Remember that successful trading requires a clear trading plan, such as the one I have outlined above. Making spontaneous trading decisions based on current market conditions is a losing strategy for an intraday trader from the outset.


