
See also


 20.11.2026 09:21 AM
Bitcoin did not follow stocks higher at the Wall Street open on Thursday and fell to $61,920, approaching a third test of the $62,000 level. That level was breached today, and price dropped toward $61,300 immediately after Anthropic's shares closed the first trading day in the red.

Although the market valued the company well above its IPO price, concerns about an overheated AI sector haven't disappeared—especially after the stock closed lower on day one.
For bitcoin, this is not encouraging. First, because the largest IPO in history soaks up liquidity that might otherwise flow into other risk assets. Second, rising pressure on the AI sector adds an extra burden to crypto markets. Given that demand for bitcoin remains weak and US spot bitcoin ETFs have not shown material inflows in recent weeks, a weak AI backdrop in equities adds another headache.
However, a historical analogy exists. Bitcoin fell roughly 19% in the 50 days before the SpaceX listing and about 18% before Anthropic. After the SpaceX listing on June 12, the price continued lower for another 18 days, to about $58,500 on June 30, and then rose about 28% over the next 100 days from the close on listing day. If the pattern repeats, a bottom could arrive in early December—around December 7—just ahead of the Federal Reserve meeting on December 9, when markets price in roughly a 90% probability of a 25-bp hike.
All this suggests that Anthropic's success is unlikely to become a locomotive for bitcoin in the near term and will more likely compete with bitcoin for investors' capital.
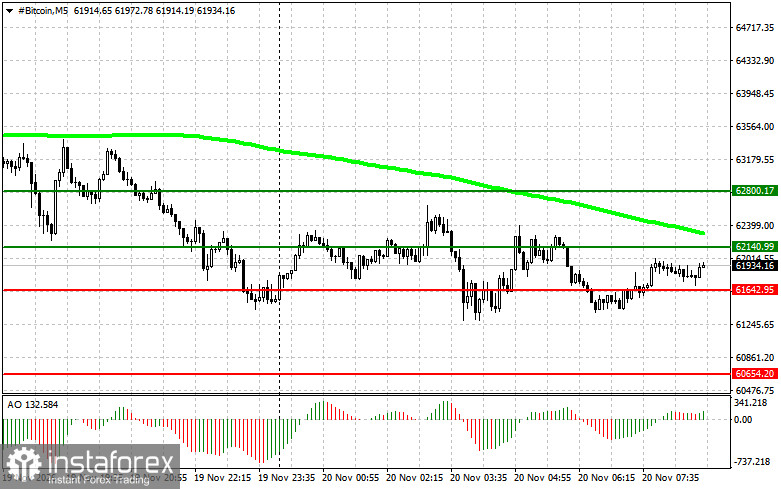
Bitcoin is currently squeezed between nearest support at 61,600 and resistance at 62,100, and the trading plan is built around two mirror directions with a full set of breakout and bounce scenarios. For buying, the first option is a confirmed close above 62,100, in which case the target is 62,800 — a logical place to take profits and consider a short on the pullback — provided price is above the 50-day moving average and the Awesome Oscillator is above zero. The second option is a rebound off 61,600 after a false downside break; in that case, buy positions aim first for 62,100 and then 62,800.
The sell picture is symmetrical. A confirmed break below 61,600 would open a short targeting 60,600, provided the moving average is above price, and the Awesome is below zero. If an upside break above 62,100 fails to confirm and price is rejected, a short would first target a return to 61,600 and then 60,600.
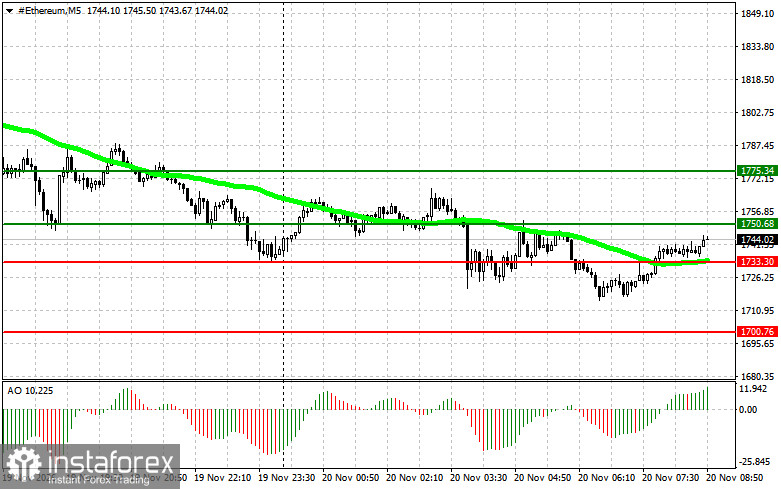
For Ether, the range is defined by support at 1,733 and resistance at 1,750, and the logic fully mirrors Bitcoin on its own price scale. Consider buying on a confirmed close above 1,750, targeting 1,775—where to take profit and consider a short on the retrace—or on a rebound from 1,733 after a false downside break, targeting 1,750 first and then 1,775. In both cases, price should remain above the 50-day moving average and the Awesome Oscillator should be above zero.
Consider selling on a confirmed break below 1,733, targeting 1,700, provided the moving average is above price and the Awesome Oscillator is below zero, or on a rejection at 1,750 without a confirmed upside break, targeting 1,733 first and then 1,700. Both indicators serve as filters to weed out false moves rather than standalone entry signals; decisions are taken only after price actually confirms the specified levels.


