
Vea también


 19.11.2026 01:06 PM
Demand for Bitcoin dropped to its lowest level of 2026, and this happened while the market was trying to hold around $63,000. The visible demand metric, according to CryptoQuant, fell below -290,000 BTC — deeper than the values seen at the summer bottom, when it was around -275,000. After a small rebound, the indicator stands at about -255,000 versus a monthly average of -172,000. The metric is calculated as the difference between new Bitcoin issuance and the volume of supply that has been inactive for more than a year; negative values mean supply exceeds demand, and there are not enough buyers to absorb coins returning to the market.

The year?to?date dynamics show that drawdowns are getting deeper and recoveries shorter. On May 25, the metric was around -147,000 while Bitcoin traded in the mid?$70,000s and was then considered the weakest since December 2025; on June 3, it reached about -275,000. By July 7, it had returned to roughly -75,000 as the price bounced from the summer low, and on November 15, when Bitcoin was trading around $65,000, it stood at about -248,000, while the annual value of the metric was roughly -1.2 million BTC. That is why the price rise from the April lows to $80,000–85,000 did not turn into a sustainable trend — it was driven more by futures than by real spot buying — and after it ended, the market returned to weakness.
The pressure is being amplified by short?term holders, who are already taking heavy losses. Their average cost basis is around $75,700, so at about $63,000 they are down more than 15%. On November 11, more than 47,000 BTC were sent to exchanges at a loss. According to CryptoQuant, this was the third?largest daily amount since July.
Still, extremely low demand can become a precursor to a trend reversal, since lower prices could attract new buyers and trigger a recovery. There are arguments for this scenario. Liquidations on November 15 exceeded $2 billion in one day and wiped out a significant portion of leverage; in the $62,000–66,000 range, buyers have already absorbed around 66,000 Bitcoins, and buy orders on major exchanges exceed sell orders by roughly 2.3 times.
All this suggests the market is approaching a capitulation zone, but there is no confirmation of a reversal yet, because the visible demand metric captures a sentiment bottom, not a price bottom.
Technical analysis and recommendations
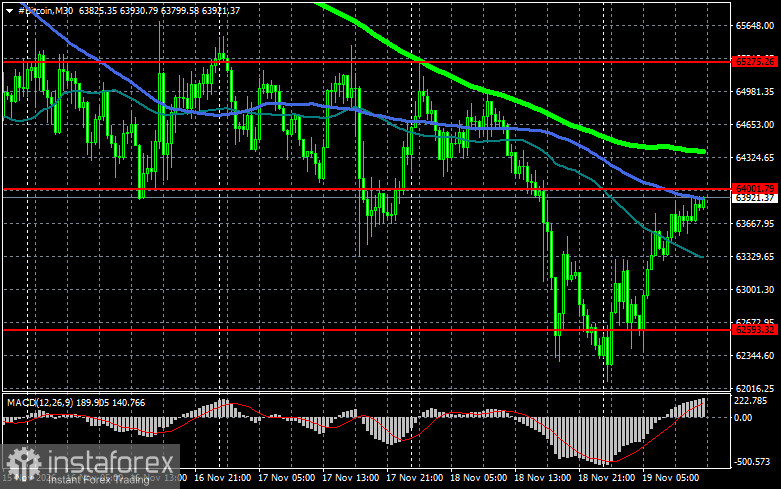
Bitcoin
Buyers are now aiming to reclaim $64,000, which would open a direct path to $65,200 and then to $66,500 — a break above that would signal attempts to restore the bull market. On the downside buyers are expected at $62,600. A drop and hold below that area could quickly push BTC toward $60,600. A further target would be the $58,500 area.
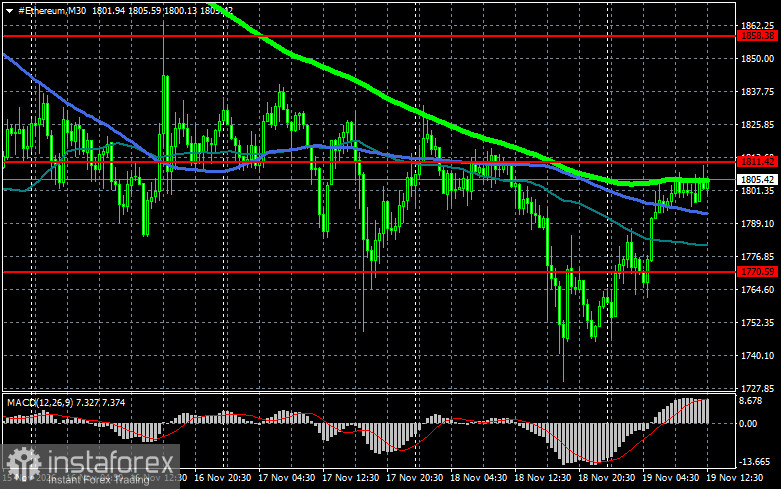
Ethereum
A clear break and hold above $1,811 would open a direct path to $1,858. The further target is the high around $1,916; a break above that would indicate strengthening bullish sentiment and a return of buyer interest. On the downside, buyers are expected at $1,770. A return below that area could quickly push ETH toward $1,726. A further target would be around $1,650.
Comments on the chart
Price testing or crossing any of these moving averages often either halts movement or injects fresh momentum into the market.


